
Trace SQL Queries
If you need to debug the performance on your website, knowing what SQL queries goes into the database is very useful. There are many advanced tools in the market that helps out, fx. NHibernate profiler that allows you to also see what queries are executed where in your code.
This article will display a more low-level approach which is using SQL server profiler that comes with your installation of SQL server.
In the article you will get one practical guide to help you debug database calls which is one sub-part of optimizing your performance.
Find a page that are slow
If you experience slow performance, finding one particular page that you think is slow and fix that is a good first step. Once you have identified it, you are probably interested in knowing what actually happens on that page. This could be a large product listing, many different queries, N+1 or similar problems.
Using SQL Server Profiler
Open SQL Server Profiler
Just search for the tool on your computer where SQL server is running. It should automatically come with the installation.
Once that is open you click 'file/new trace' and connect to the database similar to when opening SQL server management studio.
Start a trace
Once you are connected it will automaticall prompt you with tracing configuration. Here you want to select the template called 'Tuning'
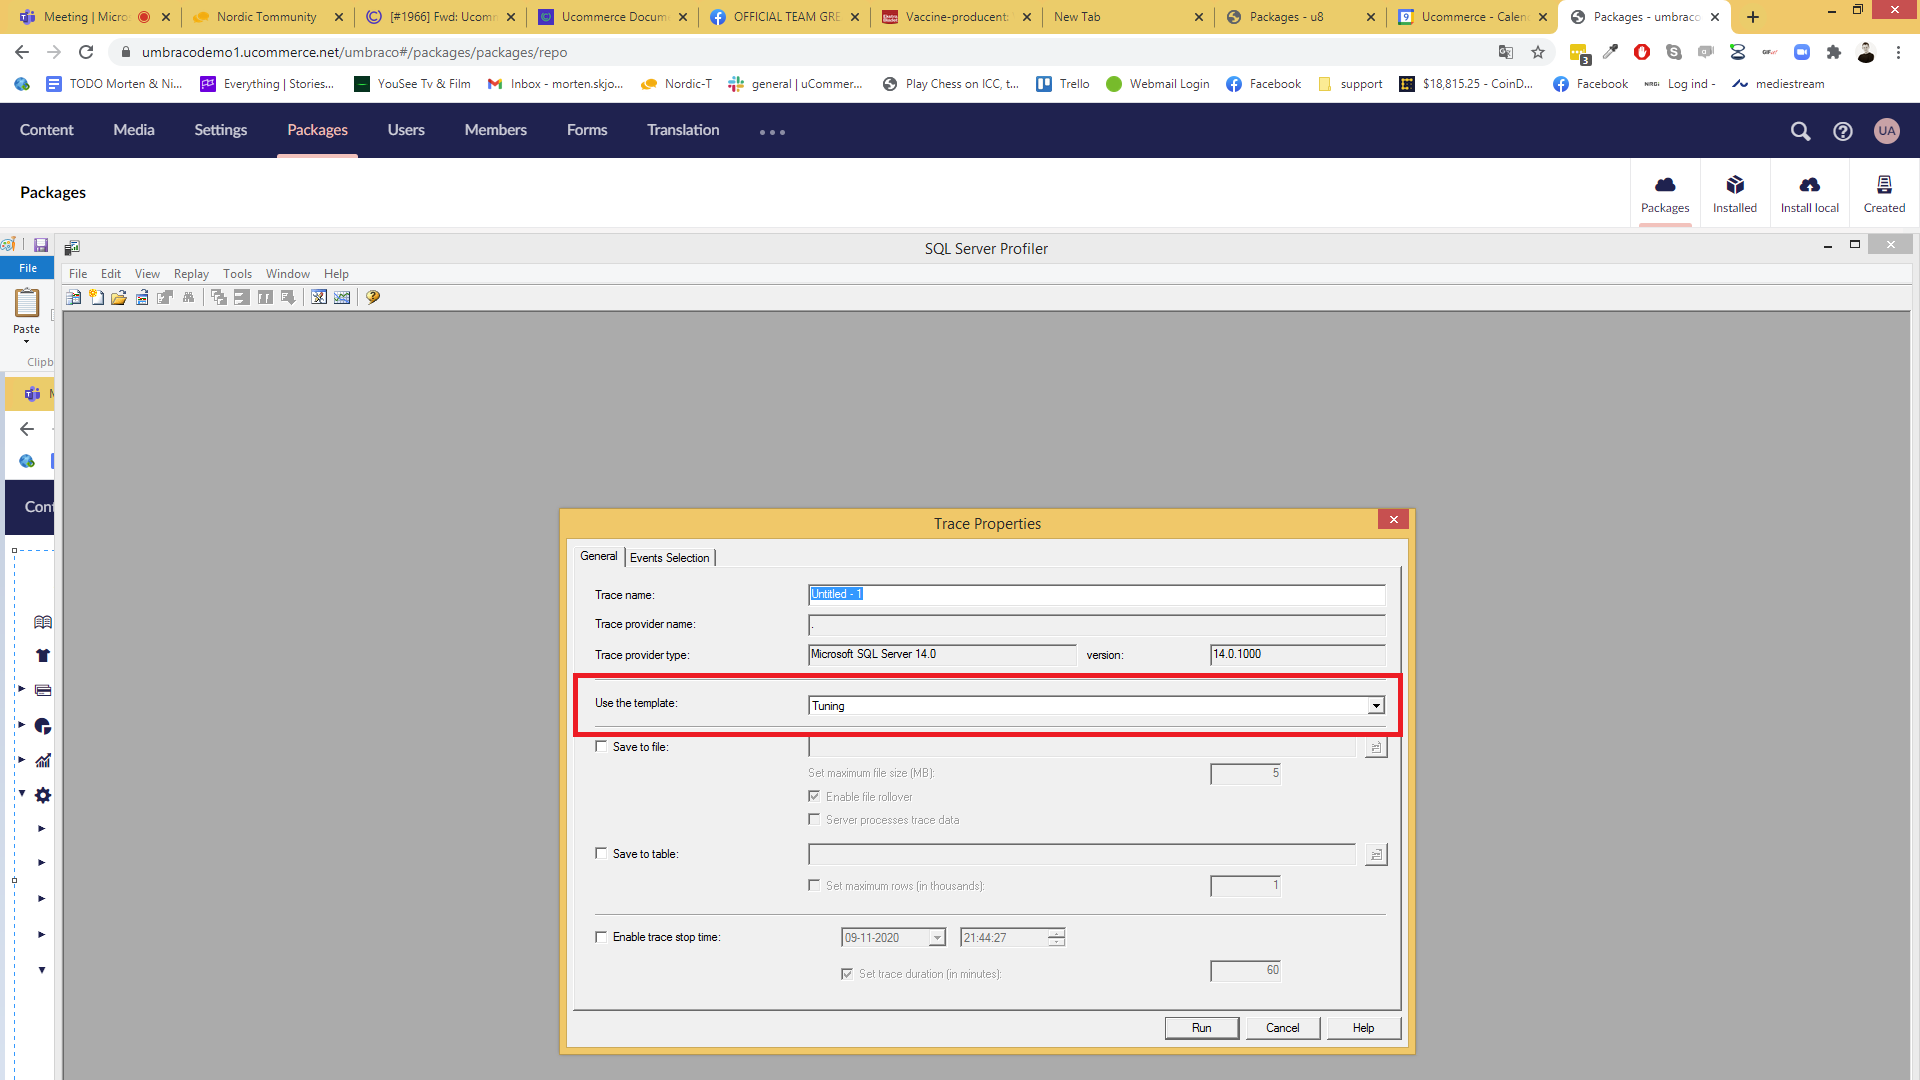
Once this is selected you need to:
- go to event selection,
- click column filters in the bottom right part of the dialog
- Select text data
- insert '%uCommerce_%'
- Finally you can choose to only see RPC (Remote procedure calls) which gives you the actual query that NHibernate executes for data.
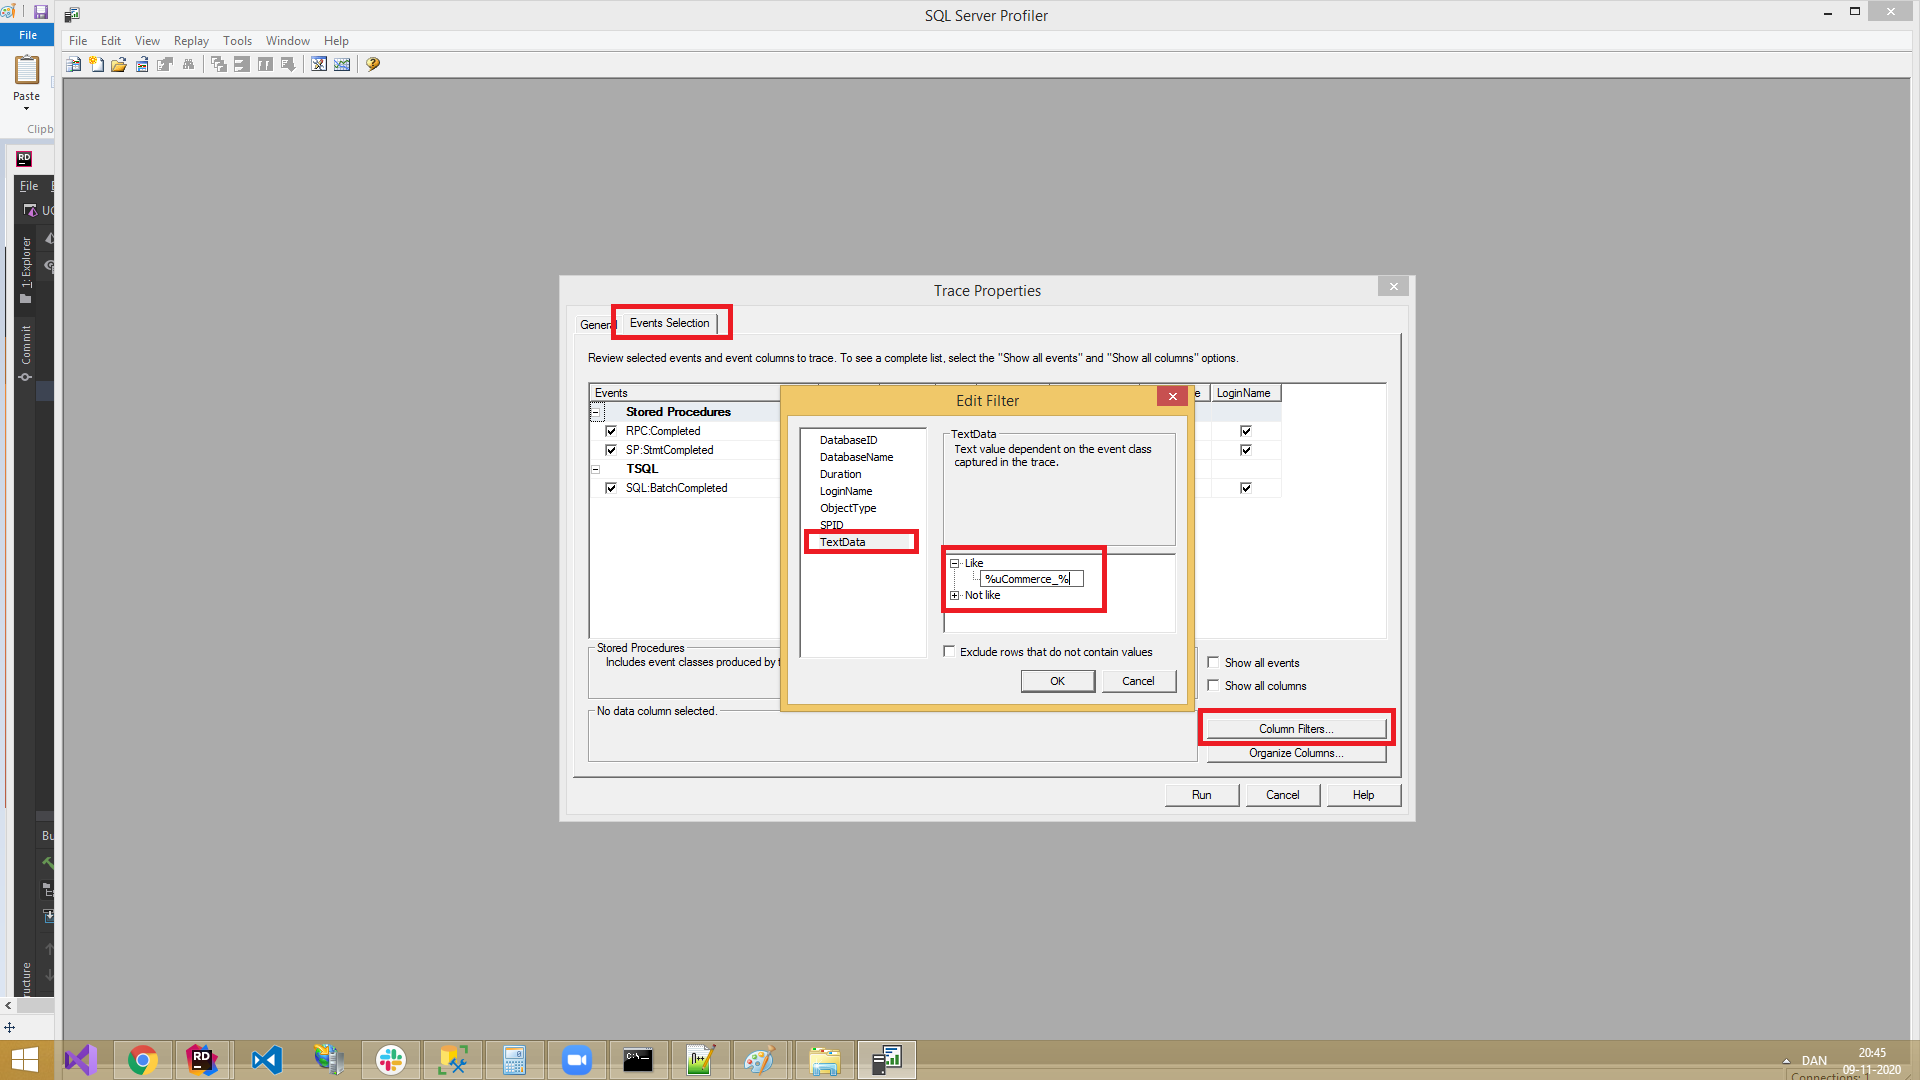
The configuration above in the image will output only the queries or commands executed against SQL server that has anything to do with Ucommerce. This is because tables in uCommerce are prefixed with uCommerce_ so this gives us an advantage to hit all the tables in one go. You will quickly be reminded that something is wrong if you haven't done this properly. Either you will be overwhelmed with the activity going on, or you will see nothing at all :-)
Reading the trace
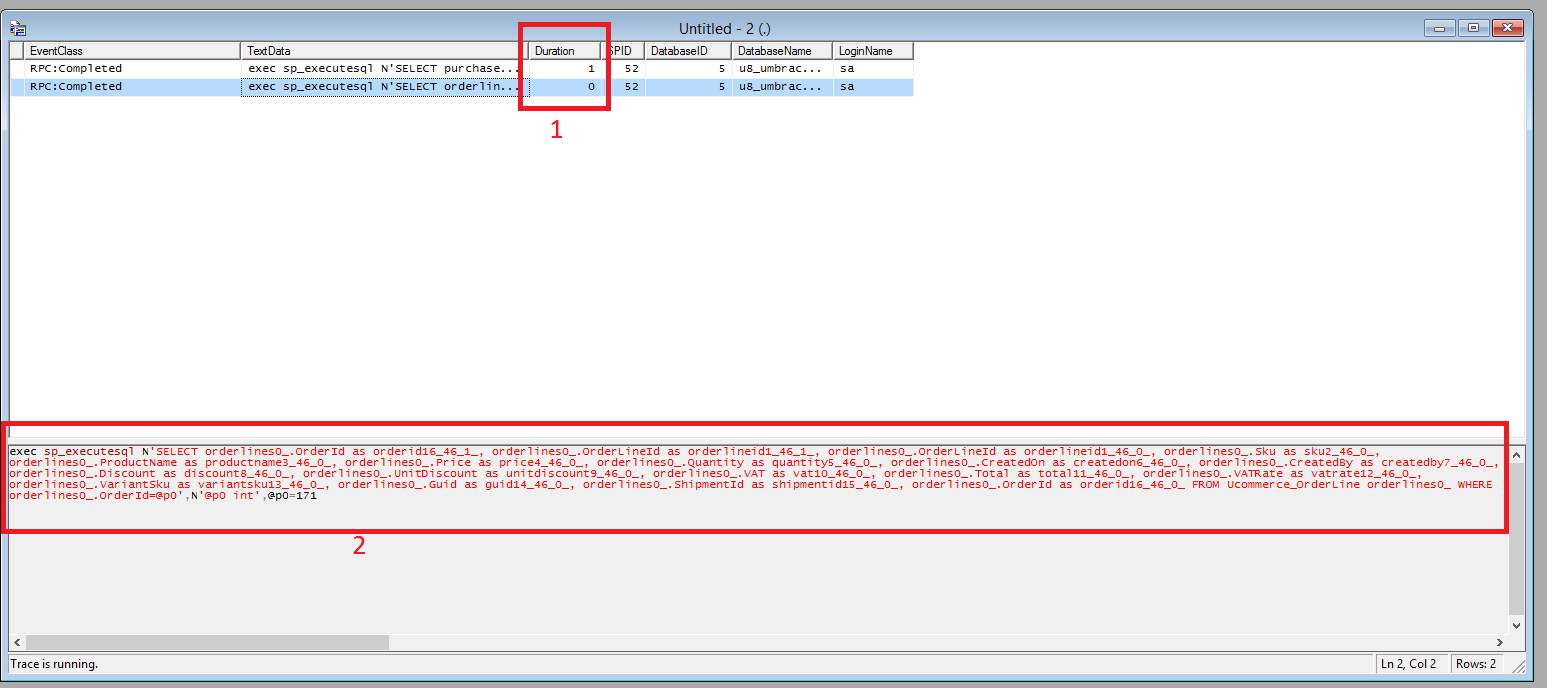
On the image above you will see the window where all data queried by NHibernate will appear. The different pieces of information are:
- Duration. This is time spent on SQL server processing the result of the query. On top of this there are transport time as well as NHibernate that needs to process the data retrieved.
- Text data is the actual query executed. You can take this query and put it into SQL server management studio to further see the execution plan or manually inspecting the result of the query.
What can I use this information for?
Firstly it will reveal if you have any slow queries that could be optimized. Secondly if you keep refreshing the page, you will be able to see queries that may not be cached / should be cahced. If the same queries are requested over and over again, it could perhaps be a good candidate for something that are supposed to be in the cache but aren't.
Order data in Ucommerce are by design not cached so you will propably see those queries :-)
Additionally it is very useful when in contact with the Ucommerce support staff as information related to debugging slow sites.
If you are interested in more tips and tricks related to NHiberante and querying, you can watch this youtube video from the Ucommerce master class.